How to Perform a Nonlinear Pushover Analysis
This article explains how to carry out a deformation-based seismic performance assessment of an existing reinforced concrete building according to TBDY 2018 Chapter 15 and Annex 5B using the Nonlinear Pushover Analysis window of StatiCAD. For the background of the method, see Theoretical Basis of Pushover Analysis; for the comparison of the results with independent software, see Pushover Analysis Verification Studies.
Which editions? Reinforced concrete performance assessment and retrofit are available in the Ultimate, Profesyonel and Betonarme editions.
1. Prerequisites
- The project must be in reinforced concrete performance assessment (existing building) mode: it is enabled under Project General Settings → Code Selection → Performance Ch.15 group. Sections, reinforcement and existing material strengths must be defined.
- A static/dynamic analysis must have been run. The pushover solver takes the member sections, the vertical load (G and Q) end forces and the modal analysis results from that calculation. If a pushover is started without running the analysis, the window gives the message "UYARI: önce analiz yapılmalıdır" (WARNING: the analysis must be run first).
- If the SAP2000 options are to be used, SAP2000 V27 must be installed and licensed on the computer (see Section 4). Without SAP2000, all analyses and reports are obtained with StatiCAD’s own solver.
2. Overview of the window
The window is opened with the Analysis → Nonlinear Pushover Analysis command.
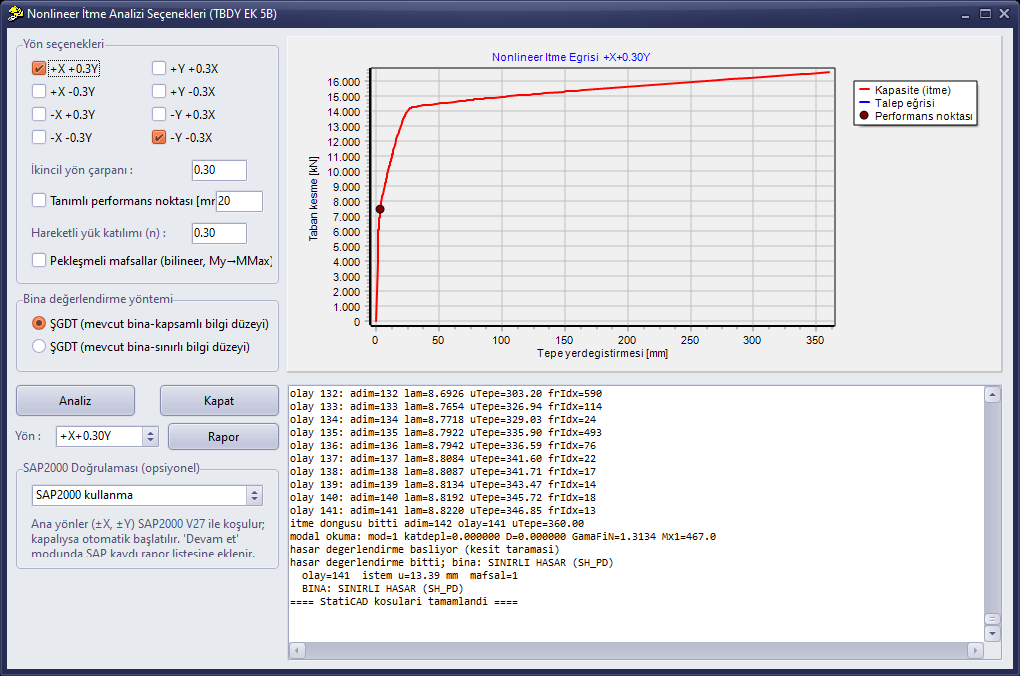
Nonlinear Pushover Analysis window: settings on the left, pushover curve at the top right, progress/result window at the bottom right.
| Area | Function |
|---|---|
| Direction options | Pushover directions and basic analysis parameters |
| Building assessment method | Selection of the knowledge level (comprehensive / limited) |
| SAP2000 Verification | Optional comparison with SAP2000, or calculation using the SAP2000 solution |
| Analysis / Close | Running the selected directions |
| Direction + Report | Obtaining the report of one of the completed runs |
| Graph | Pushover curve and performance point of the selected direction |
| Progress window | Hinge formation events, seismic demand and building decision |
3. Analysis settings
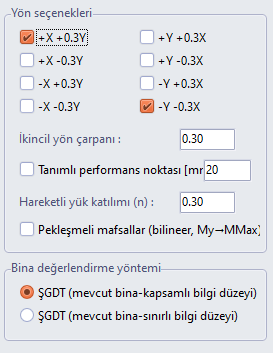
| Setting | Description |
|---|---|
| Direction boxes (8) | TBDY direction combinations: ±X principal direction ± 0.3·Y and ±Y principal direction ± 0.3·X. A separate pushover analysis is performed for each checked combination. In a typical assessment all 8 directions are checked; a single direction is sufficient for a quick preliminary check. |
| Secondary direction factor | Factor of the orthogonal component in the combination; the code value is 0.30. |
| Defined performance point [mm] | If checked, instead of computing the seismic demand, the pushover is continued up to the roof displacement entered directly (for research and comparison purposes). In a normal assessment leave it unchecked; the demand is computed automatically according to Annex 5B. |
| Live load participation (n) | The coefficient N = G + nQ used for the axial force of columns and shear walls and for the masses; it depends on the occupancy of the building (0.30 for residential and office buildings). |
| Strain-hardening hinges (bilinear, My → MMax) | When unchecked, hinges behave as elastic–perfectly plastic (EPP) (default, conservative side). When checked, after yielding the hinges rise up to MMax with the actual strain-hardening slope of the section; the capacity typically increases by 5–10%. |
| ŞGDT knowledge level | With “Comprehensive” the knowledge level factor is 1.0; with “Limited” it is taken as 0.75; the existing material strengths are multiplied by this factor. |
| Also exclude secondary beams from the LD (20%) criterion | Secondary beams (beams that rest on another beam and are not part of the lateral load-resisting system) are always excluded from the Controlled Damage 35% and Collapse Prevention 20% beam ratios. Since this exception is not stated in the wording of the Limited Damage 20% rule, secondary beams are included in the LD count while the box is unchecked; when checked, they are excluded from the LD criterion as well. The choice affects both the linear and the pushover assessment; secondary beams appear in the reports with the “[Tali]” (secondary) suffix. |
The lower part of the window also contains the multi-mode pushover, IRSA, adaptive single-mode pushover and P-Δ (second-order) options. These options are described in the article Multi-Mode Pushover Analysis and IRSA.
All settings in the window are saved in the project file; when the file is reopened, the settings you last used are restored.
4. SAP2000 options (optional)
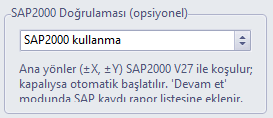
One of three working modes is selected from the drop-down list:
| Option | What it does |
|---|---|
| Do not use SAP2000 (default) | The whole calculation is performed with the StatiCAD solver; SAP2000 is not required. |
| Verify with SAP2000 (comparison) | After the StatiCAD runs are finished, the principal directions (±X, ±Y) of the selected directions are transferred to SAP2000 together with the hinges of the same model and are pushed there as well. The pushover curves of the two programs, the hinge states at the demand point and the base shear ratios are written side by side in the progress window. Your calculation results remain StatiCAD’s; SAP2000 provides an independent check. |
| Continue calculations with the SAP2000 result | Each selected direction combination is solved in SAP2000; the SAP2000 pushover curve and hinge plastic rotations are read back, and the seismic demand, damage regions, building decision and report are still produced in StatiCAD through the TBDY chain. These runs are added to the report list with labels such as “SAP +X+0.30Y” and their reports can be obtained. At the end of the runs, a summary comparison table of the results of the two programs is written to the progress window. |
Starting SAP2000: If SAP2000 is already open, StatiCAD connects to the running instance; if it is closed, it starts it automatically. The first connection may take 20–30 seconds and is shown step by step in the progress window.
The Strain-hardening hinges option is also applied to the SAP2000 runs: both solvers work with the same hinge model, so the comparison is always made with the same assumptions.
5. Running the analysis
- Make the settings and click the Analysis button.
- The pushover analysis is performed in turn for each selected direction. In the progress window every hinge formation event (step, load factor, roof displacement, member) is listed line by line; at the end of the run the seismic demand and the building decision are written.
- If SAP2000 is selected, the SAP2000 jobs continue in the background and their lines keep flowing into the same window. You can use the window in the meantime; to start a new analysis, wait until the SAP2000 queue is finished.
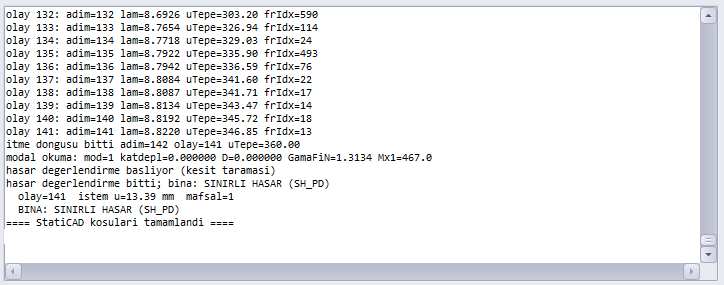
Progress window: event stream, seismic demand and building decision.
6. Results: pushover curve, performance point and report
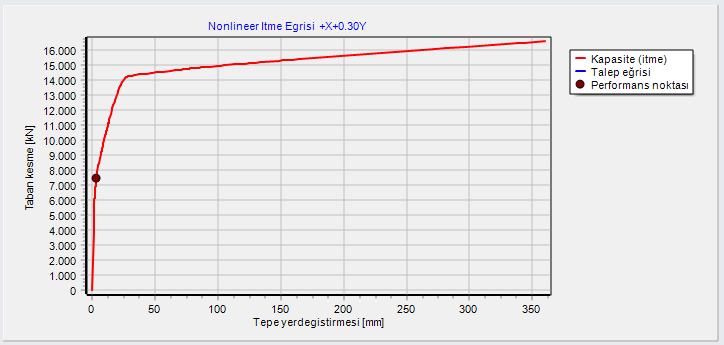
Pushover curve of the selected direction; the dark dot is the performance (demand) point computed according to Annex 5B.
- Select one of the completed runs from the Direction list; its curve is drawn in the graph.
- The Report button opens the detailed report for the selected direction. The report includes the pushover curve and modal capacity–demand graphs, the summary of the demand calculation, the applicability checks (ηbi, mass participation), member-by-member plastic rotation and damage region tables, the material models, and the strain checks of shear wall end regions. It can be printed from the preview or saved as a PDF.
- If “Continue calculations with the SAP2000 result” was used, the runs labeled “SAP ...” can also be selected from the same list and reported.
- After a pushover run, the deformed shape and plastic hinges can be followed step by step in the 3D view (see Multi-Mode Pushover Analysis and IRSA, Section 5).
7. Use together with retrofit
If the building turns out to be inadequate, the retrofit is defined on the members in the same project and taken into account with a single option. The stiffness and section effects of the retrofit (fibre-reinforced polymer wrapping, jacketing, new shear wall, infill wall) are also reflected in the pushover analysis. For details, see the article How to Retrofit a Reinforced Concrete Building.
8. Common situations
| Situation | Explanation / solution |
|---|---|
| "UYARI: önce analiz yapılmalıdır" (WARNING: the analysis must be run first) | The pushover was started without running the static analysis. Run the analysis and try again. |
| "Önceki SAP2000 doğrulaması hâlâ koşuyor" (the previous SAP2000 verification is still running) | A new analysis was started before the background SAP2000 queue finished; wait for the “SAP2000 doğrulaması tamamlandı” (SAP2000 verification completed) line in the progress window. |
| ηbi > 1.4 or mass participation < 70% warning | The applicability condition of the single-mode pushover is not satisfied (TBDY 5.6.2.2). Results are still produced, but this check is marked “SAĞLANMIYOR” (NOT SATISFIED) in the report. For these buildings, assess with multi-mode pushover or IRSA. |
| SAP2000 connection error | SAP2000 V27 is not installed or licensed, or the startup could not be completed. Open SAP2000 manually, confirm the licence and repeat the analysis; details are in the connection lines of the progress window. |
| The SAP2000 curve ends before the target | A strength drop (descending branch) is defined for SAP2000 hinges, whereas the StatiCAD hinge continues with a plateau. This is a deliberate modelling difference; comparisons are made around the demand point (see Pushover Analysis Verification Studies). |